Waste
Home » About UJ » Impact » SDG Impact » SDG 12: Responsible Consumption and Production »Waste Generated and Recycled: Tracking and Measurement
UJ Annual Reports: Waste Management
UJ Facilities Management Annual Reports
UJ Waste Generated and Recycled Data 2023
Table 1: Different types of waste recycled from January 2011 to December 2023
| YEAR | COM PAPER | WHITE PAPER | PLASTIC | CANS | E WASTE F TUBES | CARD- BOARD BOXES | GLASS | SCRAP METAL | WET WASTE | GAR- DEN REFUSE | TOTAL | % |
|---|---|---|---|---|---|---|---|---|---|---|---|---|
| 2011 | 22.452T | 26.934T | 26.689T | 13.742T | 0.14T | 37.427T | 28.74T | 29.803T | 0 | 0 | 188.71T | 3.90 |
| 2012 | 42.385T | 41.505T | 18.797T | 9.45T | 1.7T | 56.417T | 30.38T | 11.108T | 7.671T | 0 | 288.27T | 8.10 |
| 2013 | 39.46T | 40.142T | 18.028T | 10.005T | 1.21T | 37.805T | 18.793T | 7.364T | 14.2T | 136.5T | 416.63T | 17.64 |
| 2014 | 40.088T | 36.855T | 19.615T | 9.964T | 1.44T | 48.274T | 13.93T | 6.768T | 36.22T | 325.5T | 538.70T | 34.75 |
| 2015 | 31.579T | 51.725T | 20.335T | 7.117T | 0.17T | 63.932T | 31.521T | 4.071T | 15.16T | 329.14T | 506.51T | 28.55 |
| 2016 | 53.681T | 21.877T | 34.056T | 6.347T | 0.11T | 52.574T | 16.218T | 17.048T | 18.68T | 293T | 513.60T | 28.89 |
| 2017 | 40.667T | 17.526T | 42.149T | 8.189T | 6.08T | 59.824T | 27.062T | 0.552T | 4.61T | 250.98T | 456.66T | 19.56 |
| 2018 | 37.016T | 45.997T | 44.592T | 5.5515T | 1.91T | 40.346T | 5.102T | 1.34T | 8.82T | 263.14T | 521.48T | 22.54 |
| 2019 | 32.614T | 43.121T | 25.062T | 5.908T | 3.385T | 41.16T | 47.057T | 4.051T | 15.23T | 407T | 625.33T | 33.65 |
| 2020 | 21.63T | 17.98T | 12.68T | 2.58T | 2.72T | 31.58T | 19.77T | 10.26T | 30.66T | 524T | 673.86T | 47.81 |
| 2021 | 13.952T | 17.34T | 6.31T | 1.408T | 3.112T | 23.877T | 22.317T | 14.194T | 12.506T | 780T | 895.02T | 51.16 |
| 2022 | 32.158T | 16.746T | 13.811T | 2.728T | 2.862T | 29.423T | 19.771T | 5.03T | 2.629T | 719.2T | 844.33T | 40.25 |
| 2023 | 24.31T | 25.14T | 24.99T | 5.53T | 2.60T | 35.13T | 19.06T | 5.86T | 12.64T | 663.1T | 818.30T | 39.30 |
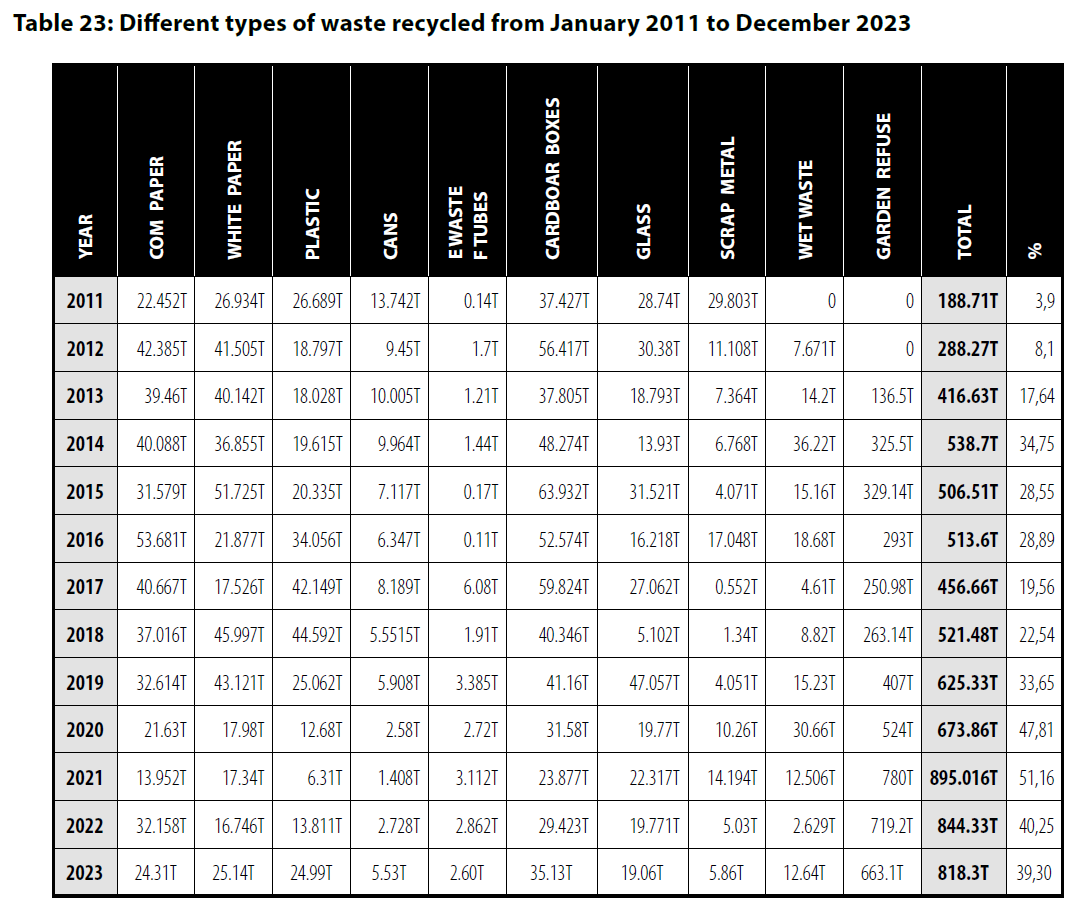
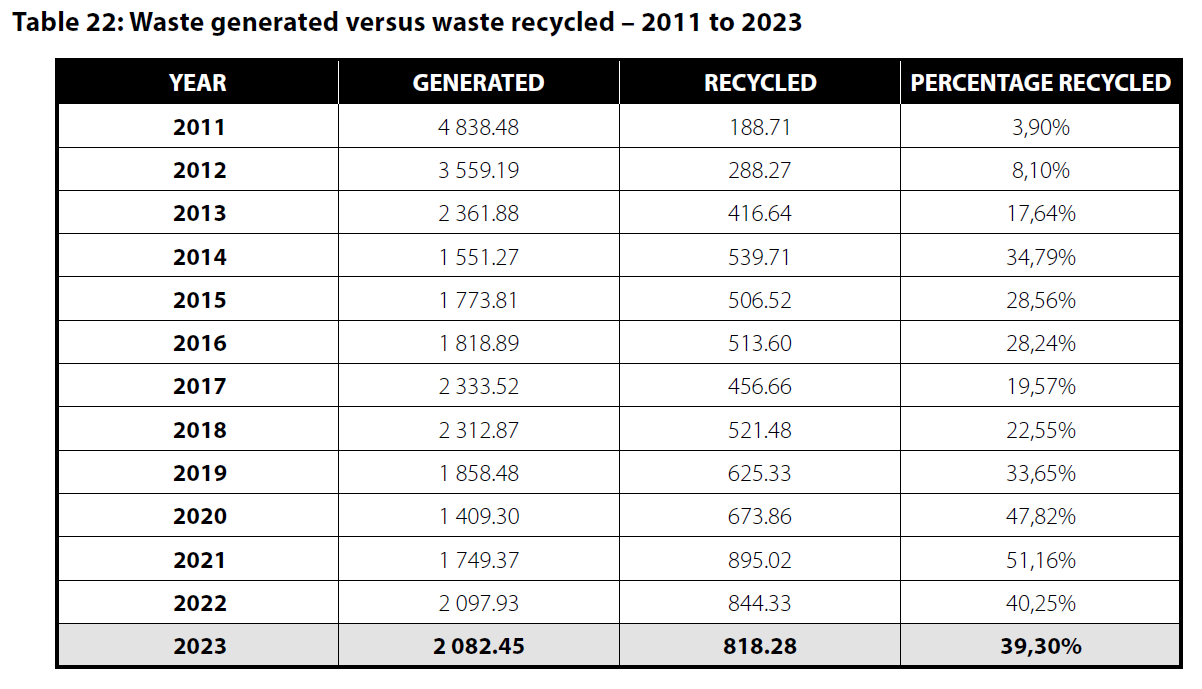
Table 2: Waste generated versus waste recycled – 2011 to 2023
| YEAR | GENERATED | RECYCLED | PERCENTAGE RECYCLED |
|---|---|---|---|
| 2011 | 4 838.48 | 188.71 | 3.90% |
| 2012 | 3 559.19 | 288.27 | 8.10% |
| 2013 | 2 361.88 | 416.64 | 17.64% |
| 2014 | 1 551.27 | 539.71 | 34.79% |
| 2015 | 1 773.81 | 506.52 | 28.56% |
| 2016 | 1 818.89 | 513.6 | 28.24% |
| 2017 | 2 333.52 | 456.66 | 19.57% |
| 2018 | 2 312.87 | 521.48 | 22.55% |
| 2019 | 1 858.48 | 625.33 | 33.65% |
| 2020 | 1 409.30 | 673.86 | 47.82% |
| 2021 | 1 749.37 | 895.02 | 51.16% |
| 2022 | 2 097.93 | 844.33 | 40.25% |
| 2023 | 2 082.45 | 818.28 | 39.30% |