Low-carbon energy use
Home » About UJ » SDG Impact » SDG 13: Climate Action »Low-Carbon Energy Use: Tracking and Measurement
UJ Annual Reports: Energy Management
UJ Facilities Management Annual Reports
UJ Low-Carbon Energy Use: Solar PV Data 2023
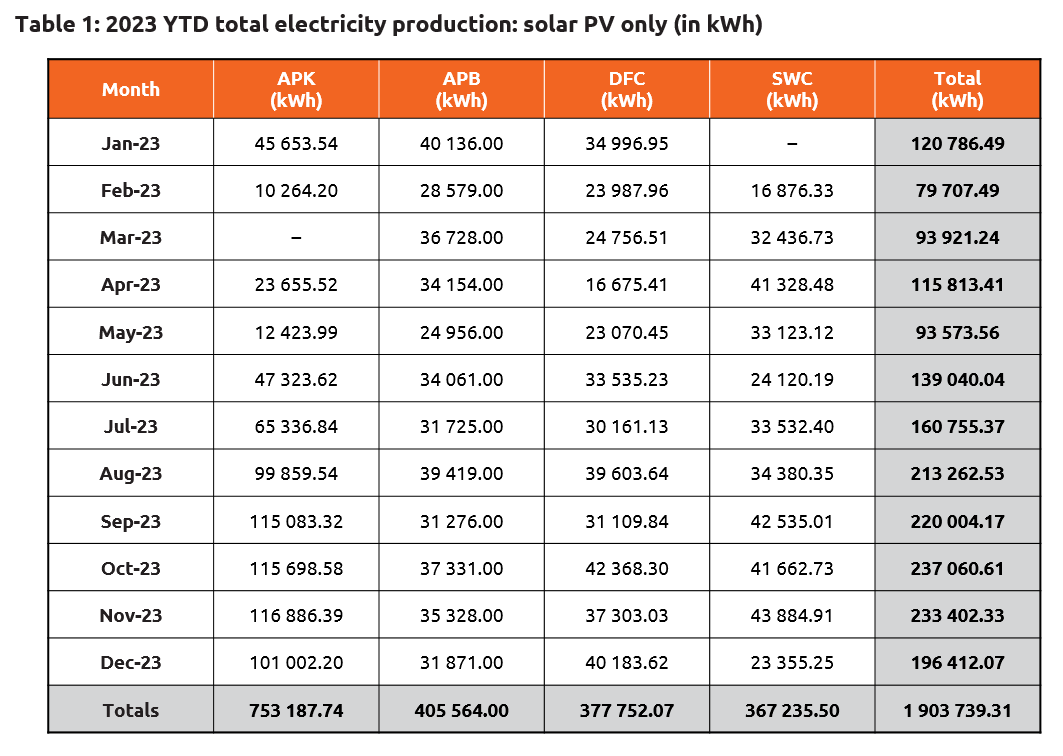
Table 1: 2023 YTD total electricity production: solar PV only (in kWh)
| Month | APK (kWh) | APB (kWh) | DFC (kWh) | SWC (kWh) | Total (kWh) |
|---|---|---|---|---|---|
| Jan-23 | 45 653.54 | 40 136.00 | 34 996.95 | – | 120 786.49 |
| Feb-23 | 10 264.20 | 28 579.00 | 23 987.96 | 16 876.33 | 79 707.49 |
| Mar-23 | – | 36 728.00 | 24 756.51 | 32 436.73 | 93 921.24 |
| Apr-23 | 23 655.52 | 34 154.00 | 16 675.41 | 41 328.48 | 115 813.41 |
| May-23 | 12 423.99 | 24 956.00 | 23 070.45 | 33 123.12 | 93 573.56 |
| Jun-23 | 47 323.62 | 34 061.00 | 33 535.23 | 24 120.19 | 139 040.04 |
| Jul-23 | 65 336.84 | 31 725.00 | 30 161.13 | 33 532.40 | 160 755.37 |
| Aug-23 | 99 859.54 | 39 419.00 | 39 603.64 | 34 380.35 | 213 262.53 |
| Sep-23 | 115 083.32 | 31 276.00 | 31 109.84 | 42 535.01 | 220 004.17 |
| Oct-23 | 115 698.58 | 37 331.00 | 42 368.30 | 41 662.73 | 237 060.61 |
| Nov-23 | 116 886.39 | 35 328.00 | 37 303.03 | 43 884.91 | 233 402.33 |
| Dec-23 | 101 002.20 | 31 871.00 | 40 183.62 | 23 355.25 | 196 412.07 |
| Totals | 753 187.74 | 405 564.00 | 377 752.07 | 367 235.50 | 1 903 739.31 |

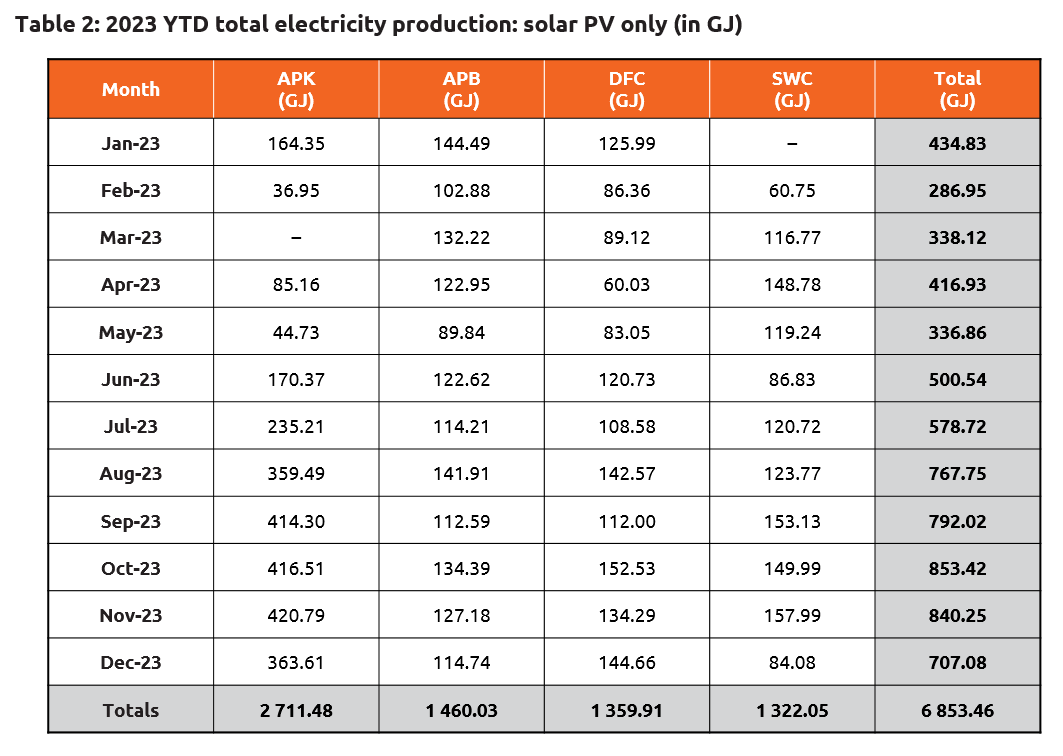
Table 2: 2023 YTD total electricity production: solar PV only (in GJ)
| Month | APK (GJ) | APB (GJ) | DFC (GJ) | SWC (GJ) | Total (GJ) |
|---|---|---|---|---|---|
| Jan-23 | 164.35 | 144.49 | 125.99 | – | 434.83 |
| Feb-23 | 36.95 | 102.88 | 86.36 | 60.75 | 286.95 |
| Mar-23 | – | 132.22 | 89.12 | 116.77 | 338.12 |
| Apr-23 | 85.16 | 122.95 | 60.03 | 148.78 | 416.93 |
| May-23 | 44.73 | 89.84 | 83.05 | 119.24 | 336.86 |
| Jun-23 | 170.37 | 122.62 | 120.73 | 86.83 | 500.54 |
| Jul-23 | 235.21 | 114.21 | 108.58 | 120.72 | 578.72 |
| Aug-23 | 359.49 | 141.91 | 142.57 | 123.77 | 767.75 |
| Sep-23 | 414.30 | 112.59 | 112.00 | 153.13 | 792.02 |
| Oct-23 | 416.51 | 134.39 | 152.53 | 149.99 | 853.42 |
| Nov-23 | 420.79 | 127.18 | 134.29 | 157.99 | 840.25 |
| Dec-23 | 363.61 | 114.74 | 144.66 | 84.08 | 707.08 |
| Totals | 2 711.48 | 1 460.03 | 1 359.91 | 1 322.05 | 6 853.46 |


